abc
Deliverable 1
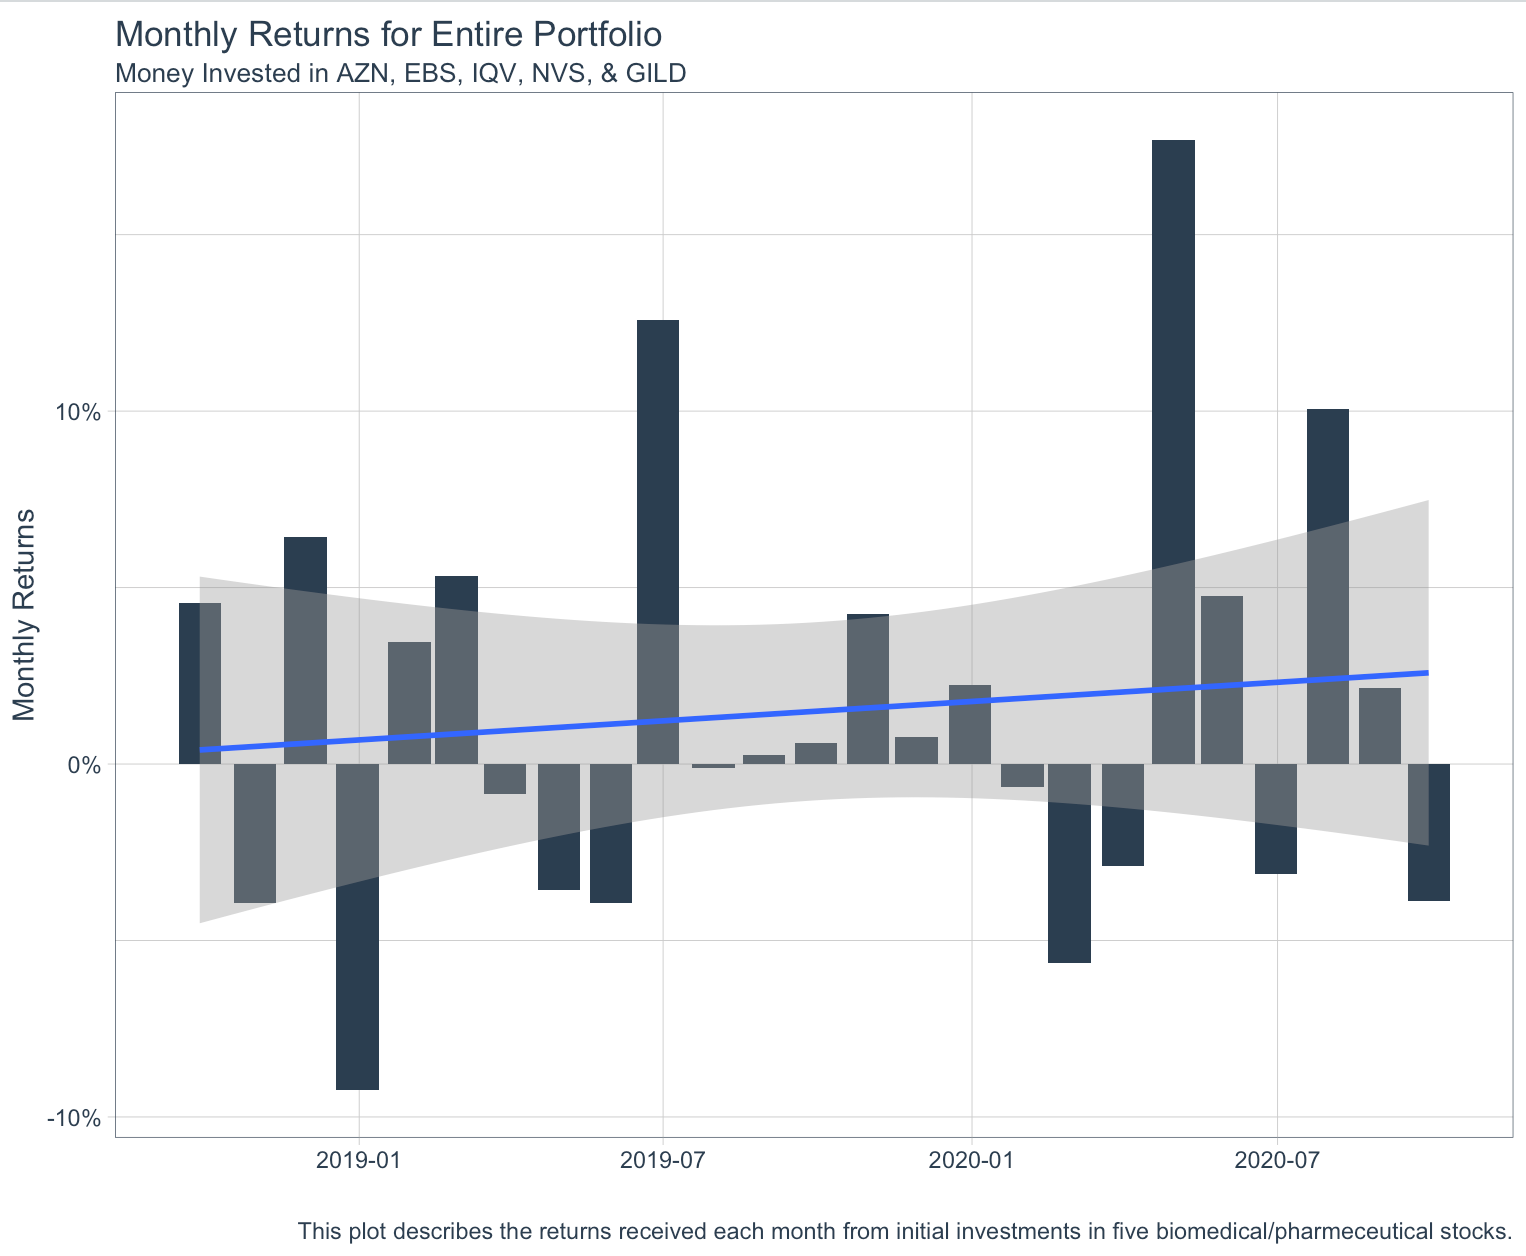
This barplot shows the returns I would have received each month had I invested $10,000 in a portfolio of five biomedical stocks two years ago.
Deliverable 2
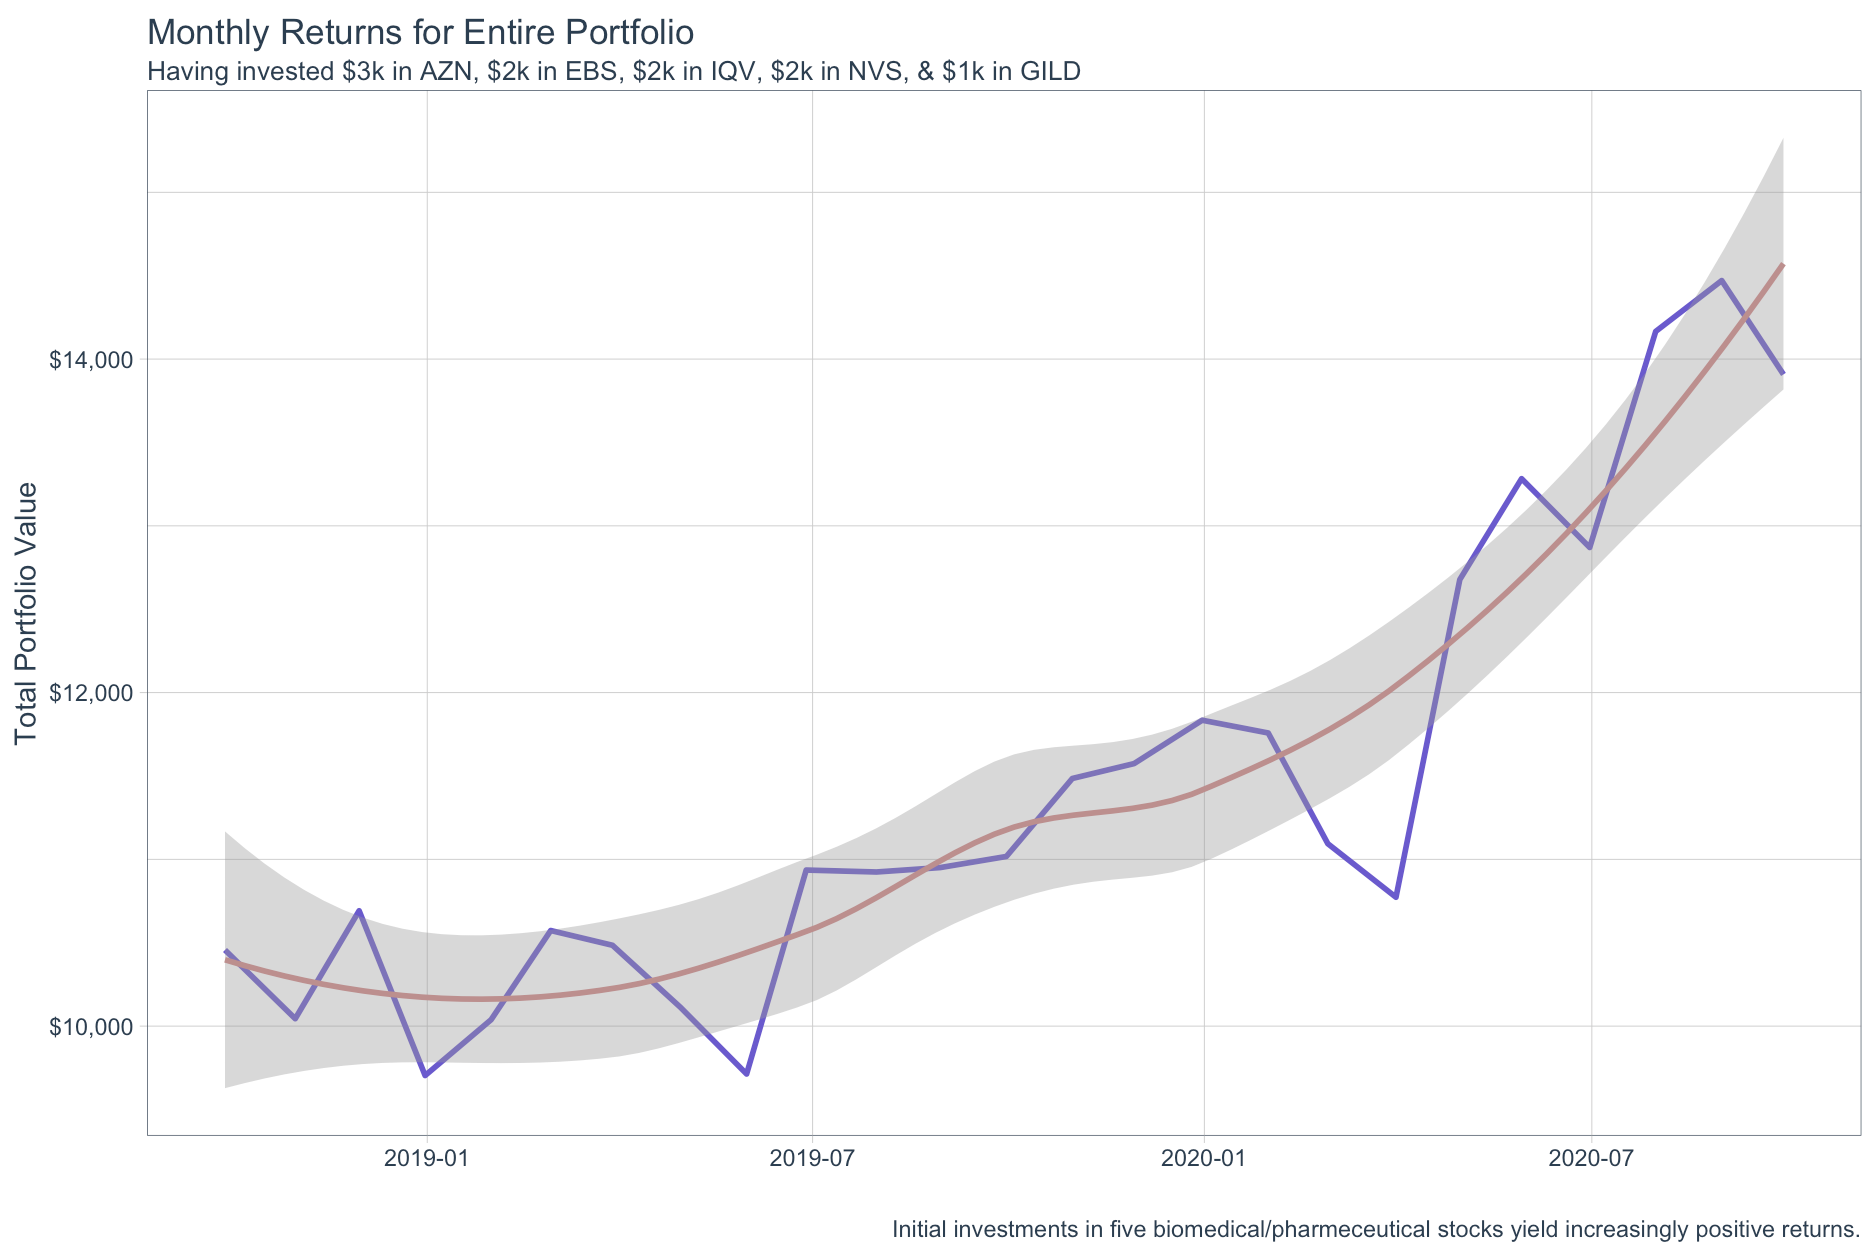
Here’s a line plot that shows the total value of my portfolio over time in the same situation as Deliverable 1.